Below are the answers to the questions we received in our webinar we hosted last month. Questions have been consolidated and anonymized. This article will be edited to incorporate a few more responses that are pending.
Read more through our whitepaper – sign up to download at the end of the article – and reach out to prachi@ramboll-shair.com for any other questions and comments!
Q. The air quality trends that you showed for PM and ozone seemed to end around 2010/11. Do you have trends for more recent years? What do the trends look like for the last decade (2010-20)?
A. PM2.5 and O3 in the EPA West region (CA and NV) has leveled off since 2010 (https://www.epa.gov/air-trends/particulate-matter-pm25-trends), we will follow up to see if we can find a more updated trend lines from the BAAQMD.
Update: While we cannot find more recent trend data from BAAQMD, information on the days of exceedances from the monitoring stations around the Bay Area up until 2018 can be found here.
Q. Can you briefly discuss how you plan to track/assess air quality improvements over time related to emissions reduction efforts? Through measurements or modeling or both?
A. We track changes in air quality over time using measurements (the static emissions inventory only changes as new iterations are released every few years). However, we are also able to assess the bias for a particular source category on the modeling side of things – helping determine if a reduction effort target a particular source is working. Additionally, if a new emissions inventory is released and uploaded into Shair, we can track the model bias from the old emissions inventory and the new one, allowing the ability to see which sources are well categorized and estimated and which are less so. All of this information can be explored in the historical feature of the Shair Tech platform that will allow for visualization of air quality at different points that be used for comparison.
Q. What tech are the remote sensors being used by GroundWork Richmond?
A. Our partner, Clarity Movement, supplied the Clarity Node-S that monitors PM2.5 and NO2 (with an optical sensor and electrochemical sensor, respectively) for installation and deployment by the Groundwork Richmond team. We deployed 40 nodes across approximately 53 sq miles. We are also bringing in data to the Shair model from public PurpleAir sensors distributed across Richmond and local regulatory monitors. The PurpleAir sensors measure PM2.5 with an optical sensor.
Q. Based on sensor evaluations, low-cost sensors have been showed to have bias errors when compared to regulatory grade instrumentation. How do you process low-cost sensor network data to ensure you are not adjusting your model to a high/low bias based on the low-cost sensor network data?
A. All Clarity nodes were collocated together prior to deployment of the network to quantify inter-device variability and correlation with an FEM monitor. To maintain calibration once the sensors are deployed in the field, we keep a few sensors continuously collocated to an FEM (possibly multiple FEMs if we are able to achieve access) and use that relationship to continuously distribute a calibration factor to the rest of the network (because we’ve seen very low inter-device variability during testing, we feel confident in this approach).
We are also using public PurpleAir sensors monitoring PM2.5. These were not colocated, but are being calibrated and QA/QC’ed.
To try to catch any false readings (since they are sensors – and can sometimes get a spider crawling in!) we have automated QA/QC procedures checking minimum, maximum, and rate of change to try to capture and flag bad readings. These procedures are not 100% effective, so we are sure to keep an eye on the data in case anything sneaks by. We completely agree that the uncertainty in these measurements is challenging, but we do feel that there is value in the spatial footprint we are able to achieve to pair up with the model and the ability to inform the public on pollution gradients at a local scale.
Q. With so many potential sources — including traffic, coal dust, industry — do you have any plans to incorporate Black Carbon measurements into your model to gain further clarity on their relative impacts?
A. Yes, we are working with AethLabs to incorporate Black Carbon measurements into our model for the next CARB Community Air grant we are implmeneting with Groundwork Richmond. We are hoping to kickoff this work in Summer/Fall 2020.
Q. You mentioned developing standards for data display via the Richmond webpage – can you speak a little more to those standards?
A. We are using WHO standards for our live map – please read our blog post on it here.
Q. is this presentation recorded?
A. Yes, you should have received it in a follow-up email – we are planning to post it to our website in the near future as well! Reach out to prachi@ramboll-shair.com for the link if you need it immediately.
Q. Would upset operation in industry be a large factor affecting the city? In other states, big refinery etc has mal-operation and can see the impact in monitors
A. This depends on a number of factors – including meteorological conditions and placement of monitoring/observations. The Shair model assumes emissions from the static emissions inventory (in the absence of some form of real-time data). An upset would make it into the real-time map if either (1) we have real-time emissions information capturing the upset, (2) a monitoring location picks up ground level signal from this upset, or (3) meteorology is causing normal operations to have more ground level impacts than usual (the model can predict this).
Q. What are the computer/IT resource requirements to run Shair?
A. We use a cloud-native pipeline in Google Cloud Platform (GCP) to run Shair. By utilizing a Kubernetes cluster on GCP, we are able to save substantial computing costs and bring higher-fault tolerance to our modeling system compared to traditional high-performance computing environments. Shair is fully configured in-house and does not require IT support – you can access everything through a browser. Compute needs vary by resolution, area of coverage, modeling frequency, and the number of measurements being collected and stored. Please reach out to us at prachi@ramboll-shair.com to discuss your specific situation in depth.
Q. Where are these monitors or how are they distributed?
A. We will have a view of the measurement points on our live map available in the near future – for now, you can refer to this link for deployment locations.
You can see PurpleAir sensor deployments in Richmond here.
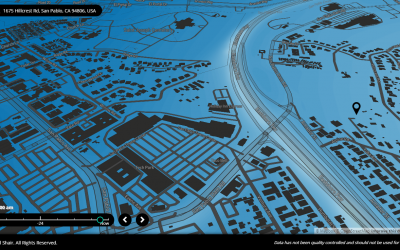
Q. Are you using LIDAR in Shairstreet to get the building canyons?
A. Yes that is correct, we used LIDAR data mapped to building footprints for a 3D map of buildings for Richmond. More details can be found here.
Q. How do you handle fleet mix on different roadway links when estimating emissions from on-road mobile sources?
A. We get a basic breakdown of vehicle types by road type from a travel demand model that is run by the Bay Area Metropolitan Transportation Commission. The travel demand model provides three basic vehicle types (passenger cars, trucks and an intermediate class). These are mapped to different vehicle types that correspond to vehicle types used in EMFAC and we use EMFAC emission factors to estimate the traffic emissions.
Q. Are the BARCT and Rule Updates provisions in AB617 helping Richmond?
A. Specific guidelines from the California Air Resources Board for community AB617 grants can be found here.
Q. Are you planning to simulate toxic air contaminants in addition to PM2.5? What type of computer infrastructure do you need to conduct these highly resolved simulations?
A. Our model is able to simulate primary toxic air containments, including apportionment (because of the use of CAMx), in addition to PM2.5 and NO2, but we are looking for a first project to deploy the technology with. While the modeling side of the solution is dependent on emissions information, the monitoring side would benefit from measurements of toxics, which can be more challenging. One alternative use of Shair in this conext, for example, is to use the real-time model to help guide the location and timing of measurement campaigns, including mobile laboratory measurements. Model simulations are run in a cloud-native pipeline utilizing a Kubernetes cluster on Gogle Cloud Platform (GCP). The model is configured in house and therefore no infrastructure is needed to access this information besides an internet connection and browser. Please reach out to us at prachi@ramboll-shair.com with any further questions – we can be flexible to various infrastructure needs and platforms!