Who is Shair?
![]()
Clearing the air
It's time to work together for change. Shair's unique combination of models and measurements bridges data across multiple sources, making it possible for everyone to better understand AQ.
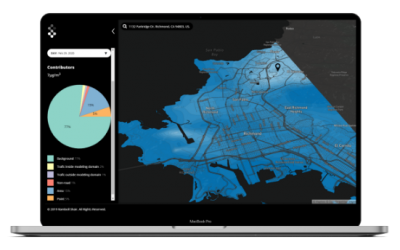
Explore the map to see how the City of Richmond, CA now has real-time access to clearly visible and highly actionable air quality insights.


Any questions
on air quality?
We’re bringing people together to ask bigger questions and find better answers on air quality.
Where are the cleanest areas of my city right now?
Shair visualizes air quality in real time anywhere, not just locations where monitors exist.
Why and where are we exceeding AQ limits? Where are the most impacted neighborhoods?
Shair lets you view AQ data in a number of ways – comparing various time averages (daily, seasonally, etc.) and spatial averaging (by neighborhood, county, or city block).
How is AQ looking for the next few days?
Shair lets you forecast AQ so everyone can be prepared for the days to come.
Where should we focus our air quality study?
Shair lets you see where your emissions inventory (reported emissions) is not doing a good job explaining measured concentrations. It also shows you where more measurement or studying is needed, either with stationary or mobile monitoring methods.
What are the sources of our AQ issues?
There is a lot of data already out there about permitted sources of pollution across your city. We use that emissions inventory in our regional model, so you can learn how much traffic, point, outside emissions, and other sources are affecting air quality where you are.
How do weather and landscape affect AQ in my city?
Every location has unique characteristics that affect the way air moves.
Weather makes a huge impact on air quality: whether emissions rise up or away from where we live, stay at ground level, or become trapped due to a low atmospheric boundary layer. We use a meteorological model to help explain how air moves around and why, and incorporate terrain and building data to closely mimic the conditions that influence air movement.
How has AQ changed over time? Where have the biggest changes happened?
We need to be taking many actions to try to improve air quality. Which actions are working and where? Shair helps bring clarity to how AQ changes in both time and space, so you can see what's working and where.

Where are the cleanest areas of my city right now?

Real-time AQ data
Where are the cleanest areas of my city right now?
Shair visualizes air quality in real time anywhere, not just locations where monitors exist.
Spatial Averaging
Why and where are we exceeding AQ limits? Where are the most impacted neighborhoods?
Shair lets you view AQ data in a number of ways – comparing various time averages (daily, seasonally, etc.) and spatial averaging (by neighborhood, county, or city block).
Forecasting
How is AQ looking for the next few days?
Shair lets you forecast AQ so everyone can be prepared for the days to come.
Hotspot Detection
Where should we focus our air quality study?
Shair lets you see where your emissions inventory (reported emissions) is not doing a good job explaining measured concentrations. It also shows you where more measurement or studying is needed, either with stationary or mobile monitoring methods.
Source Apportionment
What are the sources of our AQ issues?
There is a lot of data already out there about permitted sources of pollution across your city. We use that emissions inventory in our regional model, so you can learn how much traffic, point, outside emissions, and other sources are affecting air quality where you are.
Meteorology and Terrain
How do weather and landscape affect AQ in my city?
Every location has unique characteristics that affect the way air moves.
Weather makes a huge impact on air quality: whether emissions rise up or away from where we live, stay at ground level, or become trapped due to a low atmospheric boundary layer. We use a meteorological model to help explain how air moves around and why, and incorporate terrain and building data to closely mimic the conditions that influence air movement.
Tracking Changes
How has AQ changed over time? Where have the biggest changes happened?
We need to be taking many actions to try to improve air quality. Which actions are working and where? Shair helps bring clarity to how AQ changes in both time and space, so you can see what’s working and where.
Bringing it all together

Data
Shair’s core area of expertise lies in modelling with unrivaled accuracy. Our model is uniquely open to a flexible range of inputs, allowing everyone to better see the full truth about the air.
From traffic, to weather, to AQ readings – we can bring together the data that makes AQ clear.
Processes and science
The data continually interacts with Shair’s unique combination of CAMx photochemical and Shairstreet street-level models to reveal a rich picture of the air in near real time. This makes it possible to answer questions such as what are the sources of pollution, and to notify immediately when thresholds or patterns are breached.
Proven and unique models
Shair is powered by the cloud, so that insights from established scientific practices are now available to more people, more often than ever before. Our clear visualization, flexible approach and open APIs make established modeling techniques accessible for cities and communities who care about understanding the air we all share.
Experts and the AQ community
Shair’s platform exists not only for AQ technology innovation, but to inform and empower professionals and the public. We believe that making the truth about AQ clearly visible to everyone is the key to moving from debate about data, to action and impact. It means decisions can be taken with confidence, and communities can be kept informed as we work together towards clearer air.
 Clear thinking – our blogs
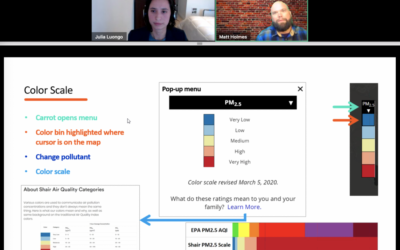
How does the Shair App work? A walkthrough of the Shair Map.
I sat down with Matt Holmes from Little Manila Rising for a webinar on February 17, 2021 describing the many features and...
Shair Published in GovTech – Users Can See San Francisco Air Quality in Real Time
https://www.govtech.com/health/Users-Can-See-San-Francisco-Air-Quality-in-Real-Time.htmlGovTech interviewed our founder, Julia Luongo, about the launch of our map in the SF Bay Area up to Sacramento - read to learn...
Shair Published in American City & County – Putting Clean Air in the hands of Municipal Leaders
Cities, counties, and communities are seeing their responsibilities expand in the pandemic public health emergency, and that...
Want more details?
The Shair whitepaper offers a detailed look into what we offer and our modeling methodology.
Request the whitepaper by following the link, below.


 Clear
Clear 

