Written by Tasko Olevski and Prachi Goel
If urban planning in the 20th century was defined by the rise and expansion of the Automotive City, the planning discourse of the early 21st century centers around how to deconstruct it. The motivations — fatal car accidents, the documented mental and physical toll of traffic jams, and air pollution-related exacerbation of respiratory diseases — make it urgent for communities to change how they move. Many cities, including San Francisco, are taking action to prioritize other methods of transportation over passenger vehicles in congested locations. To accept the cost of the disruption that comes with these initiatives, the benefits must be tangible and visible to both the professionals that work to shape cities and the communities that live in them.
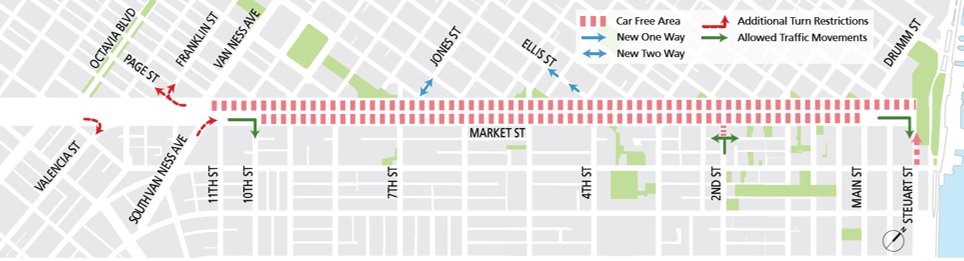
Car Free Market Street Map, courtesy SFMTA
Our team built the real-time, localized Shair model to facilitate such conversations around air pollution-reduction initiatives. Traffic emissions are a significant contributor to poor air quality in urban environments, making it a key link to pollution-reduction strategies. Shair can not only be used to understand how traffic affects air quality and related health-outcomes, but can also act as proxy for communities to understand the benefits to changing their approach to mobility.
How We Do It
To localize air pollution in the Shair model in real-time, and at a high-spatial resolution, we developed a street-level air quality model we call Shairstreet. Shairstreet’s high modeling resolution requires a detailed picture of emissions across large roadway networks. We have created our own methodology to estimate such emissions, and feed them into our model.
Why Existing Traffic Data Couldn’t Work
Traditionally, traffic emissions are part of an emissions inventory that links emissions to sources. This data is static, and often coarser that the models it feeds into. Air quality practitioners have found ways to dis-aggregate it and make it match the ideal spatial and temporal resolutions for regional modeling. But Shairstreet reaches up to a 10m x 10m resolution, which is quite different than the 1km to 4km resolutions used in regional models. To truly get to the street-level emissions, we had to take another approach and leverage the technology behind the applications that give us detailed information about traffic on our phones. We’ll explain our approach by using our deployment in Richmond for their AB617-funded project as an example — but keep in mind that we have configured the implementation to be the same for any community around the globe.
Our Approach
We broke down the problem into two components — traffic speed, and traffic flow. For speed, we elected to use location data from HERE’s Real Time Traffic API. For traffic flow, we used a travel demand model developed the Bay Area Metropolitan Transportation Committee (MTC) as a source. Combining these two data sources we can calculate traffic emissions at a high spatial resolution and in real time.
SPEED:
Vehicle emissions are significantly affected by the driving speed. For example, based on data from CARB’s EMFAC database, an average gasoline car in California in 2019 driving at 10 mph produces 5.4 times more PM2.5 (particulate matter 2.5 microns in diameter and smaller) emissions (on a per mile basis) than driving at 60 mph. Shair obtains speed data from the HERE API at a high spatial and temporal resolution that does not require further dis-aggregation. The emissions for discrete street sections and vehicle types are calculated in real time, and based on data that reflects current traffic conditions. For example, our modeling domain over Richmond, CA consists of 26,656 street segments where the emissions from three vehicle types are calculated based on real-time traffic conditions.
In the animations below, you can see the traffic speeds and emissions from a section of the I-80 freeway in Richmond and several surrounding streets. These were generated in real-time and are used in Shair. The emissions along discrete road segments follow the variation in speed that corresponds to real traffic conditions. Shair further distinguishes between the two directions on the I-80 freeway and produces higher emissions in one direction for the morning rush hour and then higher emissions in the opposite lane for the evening rush hour, for improved accuracy.
PM2.5 emissions estimates vs vehicle speed data, courtesy Shair
FLOW:
Travel demand models (TDM) are developed via roadway surveys over a period of time for transportation planning. The TDM provides detailed information about the amount of traffic, and traffic conditions, in a city or larger area. The Bay Area MTC has a travel demand model that estimates traffic conditions for the whole Bay Area. This historical data improves the model’s estimates of emissions from the real-time speed data from HERE API by aligning it to where the TDM indicates the traffic is. Additionally, by using the TDM, the air quality data used by Richmond’s AB-617 steering committee is now aligned with the Bay Area Metropolitan Transportation Commission. When the travel demand model is updated, the air quality model can also be easily updated to reflect these changes.
With these two sets of information, we are able to pull together city-wide, real-time traffic emissions estimates that meet the high-resolution of the Shairstreet model and are consistent with traffic department data. This method can be extended to other transportation domains, like marine, air, and rail, to help us understand how those other pollution sources affect the air we breathe.
Our approach to calculating emissions is just one component of how Shair innovates to bring together data that helps bring together communities on defining the future together. How could you use this data?